Microsoft Teams Live Events have become an indispensable tool for enterprise communications. From high production events like company-wide town halls to crisis communications requiring quick turnarounds, Teams Live Events can engage and connect distributed workforces. To ensure these communications are successful, Live Event reporting is crucial.
In a recent webinar, What Great Analytics Reveal About Microsoft Teams Live Events, Garrett Gladden, Director of Product Management at Kollective, outlined the importance of understanding Live Event reporting data, identifying key performance indicators (KPIs) for Live Events and how adding an advanced analytics platform provides those insights where and when you need them.
Let’s Talk Teams
Teams Live Events are an extension of Teams Meetings meant for one-to-many communications. With Live Events you can broadcast to up to 100,000 attendees no matter their location or device.
Garrett was joined by Raphael Barini, Microsoft Modern Workplace Technical Architect at the time of the recording, who ran a quick demo on creating and running a Teams Live Event. In the demo he covered:
- How to set-up a Live Event in Teams
- A breakdown of the different options you have when creating your event
- Best practices for inviting attendees
- Starting and managing the event as a Producer
The ease and simplicity of Teams Live Events allows anyone in the organization to set-up an event to relay important messages efficiently and at scale.
Data Needs Meaning
Teams Live Events produce a large amount of data. To be of any value in running a successful event, that data needs meaning. Finding that meaning, Garrett explained, requires two things – recency and relevance. Recency requires accessing the data when you need it which, to be actionable, is during the event. To achieve relevance, that data needs to be surfaced where you need it, in a centralized and easy to use dashboard.
Meaningful (and Easy) KPIs
Teams Live Events provide Attendee Engagement reports you can download after the event but does not provide actionable data in a usable format while the event is in process. To access this data as well as additional insights into video performance and employee engagement in real-time Garrett recommended using an advanced analytics platform like Kollective IQ.
Using a Southeast Asia business strategy planning event as an example, Garrett detailed the metrics you can access from a Teams Live Event with Kollective IQ. The event was held during COVID-19 lockdowns with the majority of attendees joining the event from home. The high-level analytics pictured in the dashboard below show that the event was a success.
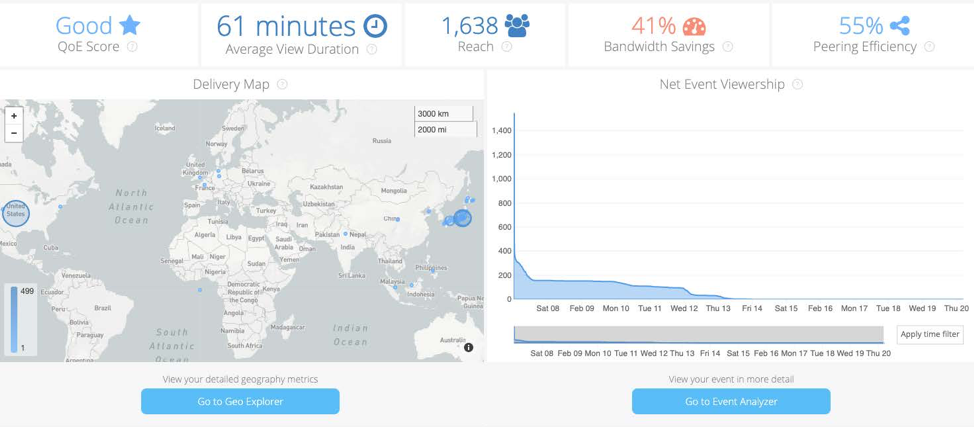
Quality of Experience (QoE) Score shows what the experience was for everybody receiving the event content. The score is a combination of two metrics – the bitrate or quality of the video they received and the time to first frame or how long they waited for the video to arrive.
Average View Duration measures whether viewers stayed for the duration of the broadcast or dropped off letting you know how much of the content was consumed.
Reach indicates the attendance rate for the event and is measured by unique viewers.
Bandwidth Savings is the amount of bandwidth saved by using Kollective’s Enterprise Content Delivery Network (ECDN) to deliver the live event.
Peering Efficiency is another indicator of the ECDN’s performance and in this example shows that high concentration regions were able to share content at the edge, pulling the Live Event from a peer rather than the network.
Geo Explorer shows where the content was consumed.
This data quickly answers the questions:
- Did attendees have the experience that we wanted?
- Did people watch for the duration showing that we effectively communicated with them?
- Did we reach the number of people that we targeted?
- Did we reduce strain on our network?
- Did Kollective’s peering do the heavy lifting instead of our network?
- Where and by whom was the content consumed?
For a deeper understanding of the data or specific users, Kollective IQ allows you to drill down into and explore each of these metrics.
Teams + Kollective IQ
Microsoft Teams lets you produce and distribute live events to your entire workforce no matter their location or device. Adding an advanced analytics platform to the mix lets you visualize your attendee experience and network performance and make real-time adjustments.
Kollective IQ offers you:
- Persona-based workflows with stellar UX
- Delivery of ALL data to clients, with data mining, exploration, and custom
- calculations
- Custom visualizations and dashboards
- Data exportability with many formats to many destinations
Test out Kollective IQ’s valuable and actionable insights for Teams Live Events today.